Abstract: The power monitoring system of Wuhan Aiji Auto Parts Co., Ltd. is introduced. Intelligent power meters are used to collect various electrical parameters at the distribution site and detect the quality of the eight incoming power loops. The system adopts the on-site local networking method. After networking, it communicates via the field bus and transmits it to the background. The Acrel-2000 power monitoring system realizes the management of power distribution circuit substations in substations.
Key words: Wuhan Aiji ; auto parts ; power monitoring system ; power distribution retrofit; smart power meter ; Acrel-2000 ;
Overview Â
The company is a Sino-foreign joint venture jointly invested by Inchiichi Motors Co., Ltd. and Guangzhou Aiji Auto Parts Co., Ltd., and it officially settled in Wuhan Donghu Development Zone on February 25, 2005 with a registered capital of 1.1 billion yen and a total investment of 2.75 billion yuan. JPY.
The company's main business scope is: design, development, processing of key automotive parts and components, automotive, motorcycle molds, inspection tools and fixtures; sales of the company's products, and provide technical advice and technical services.
This project is a transformation project of Wuhan Aiji Auto Parts Co., Ltd. substation . According to the requirements of power distribution system management, eight low-voltage distribution lines in three substations of Wuhan Aiji Auto Parts Co., Ltd. need to be monitored for power to ensure safe, reliable, and efficient operation of the power circuit .
Acrel-2000 low-voltage intelligent power distribution system makes full use of the latest developments in modern electronic technology, computer technology, network technology and fieldbus technology, and conducts distributed data acquisition and centralized monitoring and management of the power distribution system. The secondary equipment of the distribution system is networked. Through the computer and the communication network, the field devices of the decentralized power distribution station are connected into an organic whole, and remote monitoring and centralized management of the power grid operation are realized.
1 System Structure Description
The monitoring system mainly realizes power distribution monitoring and power management of eight power distribution cabinets in three distribution rooms of Wuhan Aiji Auto Parts Co., Ltd.; the monitoring range is T 1, T 2, and T 3 for the transformation of substations . The T4, T5, D1, D2, and D3 line-in-board meters of eight transformers provide remote real-time monitoring and power management. The system has a total of 8 instruments, divided into 2 busses, which are directly connected to the serial port server by the shielded twisted-pair cable to the duty room, and realize the data connectivity between the instrument on the bus and the monitoring host.
The power monitoring system uses a relatively simple and easy-to-understand diagram display; as shown below:
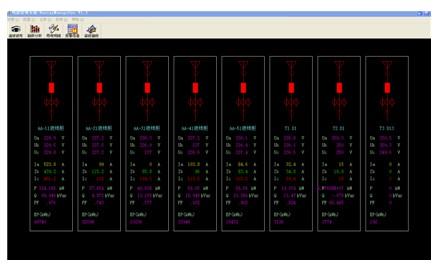
figure 1)
2 main functions of the power monitoring system
2.1 Data Acquisition and Processing
Data acquisition is the basis of power distribution monitoring. Data collection is mainly accomplished by the underlying multi-function network instrumentation to achieve local real-time display of remote data. The signals that need to be collected include: three-phase voltage U, three-phase current I, frequency Hz, power P, power factor COS φ, power EPI, harmonics, and remote device operating status.
The data processing mainly displays the electrical parameters collected according to requirements in real time and accurately to the user, so as to meet the requirements of automation and intelligence of the power distribution monitoring, and store the collected data in the database for user query.
2.2 Human-computer interaction
The system provides simple, easy to use, and good user interface. Using the full Chinese interface, the CAD graphic shows the electrical main wiring diagram of the low voltage distribution system, shows the equipment status of the power distribution system and the corresponding real-time running parameters, the dynamic refresh of the screen in real time, the analog display, the switch display, and the continuous record display.
2.3 Diachronic events
The duration event viewing interface provides users with easy and friendly human-computer interaction by viewing the fault records, signal records, operation records, and over-limit recordings that have occurred. You can view the platform through historical events. You can easily locate the fault according to your requirements and query conditions. The historical events that you want to view provide you with good software support for the operation of the entire system.
2.4 Database Establishment and Query
It mainly completes remote measurement and remote signal acquisition, and establishes a database to generate reports regularly for users to query and print.
2.5 User Rights Management
For different levels of users, different permission groups are set to prevent the losses caused by human misoperation to production and life, and to realize the safe and reliable operation of the distribution system. You can use user management to perform user login, user logout, password change, and add/delete operations to facilitate the user's modification of accounts and permissions.
2.6 Running load curve
The load trend curve function is mainly responsible for regularly collecting incoming lines and important loop current and power load parameters, and automatically generating running load trend curves to facilitate users to understand the operating load status of the equipment in a timely manner. Click the corresponding button or menu item of the screen to complete the switching of the corresponding function; you can view the real-time trend curve or historical trend line; you can perform operations such as pan, zoom, and range conversion on the selected curve to help the user enter the line trend.
Potential analysis and fault recall provide intuitive and convenient software support for analyzing the operating status of the entire system .
2.7 Remote Report Query
The main function of the report management program is to design the report style according to the needs of the user, and the data processed in the system is filtered, combined and statistically generated to generate the report data required by the user. This program can also be based on the needs of users of the report file to save, print or summon save, print mode. At the same time, this program also provides users with management functions for generated report files.
The report has the functions of freely setting the query time to realize daily, monthly, and annual energy statistics, data export, and report printing.
3 Case Studies
3.1 Customer requirements
Wuhan Aiji Auto Parts Co., Ltd. 3 Distribution Rooms A total of 8 power distribution cabinets are used for power monitoring and power management; monitoring range is to transform T1, T2, T3, T4, T5, D1, D2 of substations. And D3 a total of eight transformers in the line cabinet side of the instrument for remote real-time monitoring and power management . Customer supply power distribution room power monitoring requirements table:
Features
Functional description
real-time display
The monitoring information of voltage, current, power, power factor, 2-31 individual harmonic components, frequency, etc. is refreshed in real time, and is visualized and dynamically displayed in a graph.
trend analysis
Complete the trend curve of the voltage, current or power of each distribution circuit to facilitate analysis of the circuit distribution operating conditions
Power Management
Completion of the power collection function of each loop, and automatically generate electricity reports that meet customer management requirements. All reports or charts support query printing.
Event alarm
Alerts the communication status or abnormal power consumption of each monitoring point, so that the management personnel can grasp and analyze the distribution operation situation in real time
Customer's requirements for reporting: report currents, voltages, power, power factor, 2-31 harmonics, generator room and room temperature humidity, and support historical data printing.
3.2 Implementing Functions for the Project Software
In this retrofit project, eight ARKRAY ACR series harmonic meters are designed to measure the power monitoring needs of power systems, industrial and mining enterprises, public facilities, and smart buildings. It can measure all conventional power parameters, such as : Three-phase voltage, current, active power, reactive power, power factor, frequency, active power, reactive power, harmonics and other electrical parameters. The series of network power meters are mainly used in substation automation, distribution network automation, residential power monitoring, industrial automation, energy management systems and intelligent buildings.
Figure 1 shows the main parameters of the 1# main transformer (Figure 2). The main function of the power transformer is to monitor the electrical parameters of the operating equipment, including: three-phase voltage, current, power, power factor, electrical energy, frequency and other electrical parameters and distribution loops. Three-phase current; Remote signal function to display the operating status of the field devices, including: switching of the switch, closing operation status and communication failure alarm. Â Â

Figure (2) 1# primary transformer diagram Â
Parameter meter reading functions, mainly to complete the electrical parameters of low pressure into the line each outlet circuit of queries. Supports electrical parameter query at any time, with functions such as data export and report printing. The report queries the electrical parameters of each low-voltage circuit of the transformer outlets of two substations, which mainly include: three-phase current, active power, and active power. The names of the loops in this report are associated with the database to facilitate the user to modify the loop names. See (3).

Figure (3) Parameter reading
The electricity consumption report function can select the time period to inquire, supports the accumulated electricity inquiry at any time , and has the functions of data export and report printing. Provide accurate and reliable power report for duty personnel. The names of the loops in this report are associated with the database to facilitate the user to modify the loop name. Â See Figure (4).

Figure (4) Energy Report
The harmonic curve function mainly completes the statistics of the harmonic components of the low-voltage outlet loop, providing the on-duty personnel with an intuitive, accurate, and reliable grid quality report. The curve has functions such as data export, historical data query and report printing. See Figure (5).

Figure (5) Harmonic Report
The schematic diagram of the system communication structure mainly shows the network structure of the system. The system adopts a hierarchical distributed structure and simultaneously monitors the communication status of the equipment at the bay level. Red indicates normal communication and green indicates communication failure. See Figure (6).

Figure (6) System Communication Structure
The load trend curve interface allows you to visually check the load operation of the loop. View real-time and historical trend curves, click the corresponding button or menu item to complete the switching of corresponding functions; help the user to enter the trend analysis and fault recall, with curve printing function. Provides intuitive and convenient software support for analyzing the health of the entire system . See Figure (7).
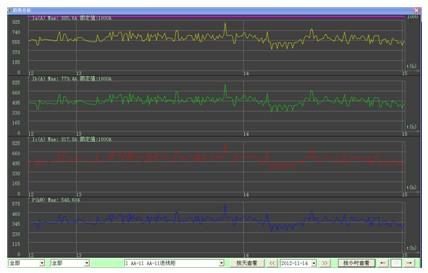
Graph (7) Trend Graph
4 Conclusion
With the development of society and the wide application of electricity, the power monitoring system has become an inevitable choice for large-scale multi-substation users, such as key construction projects, landmark buildings, and large-scale public facilities throughout the country. The Acrel-2000 power monitoring system introduced in this paper is introduced. The application of the transformation of three substations in Wuhan Aiji Auto Parts Co., Ltd. can realize real-time monitoring and power management of substation low-voltage power distribution circuits. It can not only show the power status of the circuit, but also has network communication functions. With the serial port server, computer and other components of the power monitoring system. The system analyzes and processes the collected data, displays the running status of each distribution circuit in the substation in real time , and has a pop-up alarm dialog box and alarm sound prompts for analog sub-switching and load over-limit, and generates various electric energy reports. Analyze curves, graphs, etc. to facilitate remote meter reading and analysis and research of electric energy. The system is safe, reliable, and stable. It provides real and reliable basis for substation users to solve electricity problems and has achieved good social benefits. [2]
references:
[1]. Ren Chengcheng, Zhou Zhong. Principles and Application Guide for Digital Meters for Electric Power Measurement [M]. Beijing. China Electric Power Press, 2007. 4
[2].Zhou Zhouzhong, et al. Product Selection and Solution of Smart Grid User-end Power Monitoring and Power Monitoring System[M]. Beijing. Machinery Industry Press. 2011.10
Wedge Bolt,Wedge Pin,Building Hardware
Shandong Shanglong Economic and Trade Corporation Ltd , http://www.chthreadedrod.com